Abstract
Accurate subtype prediction and measuring intratumor heterogeneity in cancer are vital for effective diagnosis and therapy. High-throughput multi-omics technologies generate extensive, challenging-to-integrate data. We propose an autoencoder-based method using deep learning to estimate heterogeneity and predict cancer subtypes. By training on diverse multi-omics data, including genomic, transcriptomic, and epigenomic profiles, we capture underlying patterns and correlations. This knowledge can lead to novel therapeutic targets and personalized treatment plans. Our autoencoder-based approach offers a strong and efficient solution for cancer subtype classification and heterogeneity assessment, contributing to precision healthcare and improved patient outcomes in oncology.
Introduction
The project's main goal is to create a cutting-edge autoencoder-based method for estimating intratumor heterogeneity levels from multi-omics data and predicting cancer subtypes. With the goal to effectively anticipate cancer classifications and gauge intratumor heterogeneity levels, the research intends to revolutionize cancer analysis. This method makes use of autoencoder techniques to find concealed representations, identify relevant features, assess differential expression patterns, cancer subtype predictions, and intratumor heterogeneity level estimations using multi-omics data. The pipeline intends to improve the cancer subtype categorization and offer substantial knowledge into intratumor heterogeneity by integrating a variety of molecular data sets, including genomes, transcriptomics, and epigenomics. This project's results have the potential to make substantial strides in cancer research and support individualized treatment plans for better patient outcomes.
Objective
Autoencoder Based Approach for Cancer Subtype Prediction and Intratumor Heterogeneity Level Estimation Using Multi Omics Data
• pandas
• numpy
• matplotlib.pyplot
• seaborn
• tensorflow
• tensorflow.keras.layers
• tensorflow.keras.models
• scikit learn
Microsoft Word, Excel, and PowerPoint were also utilized to develop presentations, documentation, and visualizations in order to effectively explain the project's outcomes. These technologies made it easier to organize and present data, analysis, and insights in a way that was both understandable and appealing to the eye.
Code
Dataset
This analysis utilized four distinct breast cancer datasets from TCGA: RNA Seq (Gene Expression), Gene Mutation (Genomic), DNA Methylation (Epigenomic), and Clinical Data. The goal was to investigate breast cancer subtypes using dimensionality reduction, clustering, and machine learning algorithms. RNA Seq data described gene activity in breast cancer samples, while the Gene Mutation dataset identified genetic variants. The DNA Methylation dataset provided information on epigenetic changes impacting gene expression and cancer development. The original datasets included 1076 RNA Seq samples, 969 Mutation samples, 1079 DNA Methylation samples, and 1240 Clinical Data samples from TCGA-BRCA. Data collection was facilitated through USCS Xena Browser from the University of California Santa Cruz, containing genomic sequence data and corresponding gene expression, mutations, and methylation values.
Methodology
Data Pre-processing: Boruta Feature Selection Algorithm & Normalization of Data
. Machine Learning Analysis: Autoencoder Model (Artificial Neural Network with unsupervised learning of Latent Representation’s).
Implementation
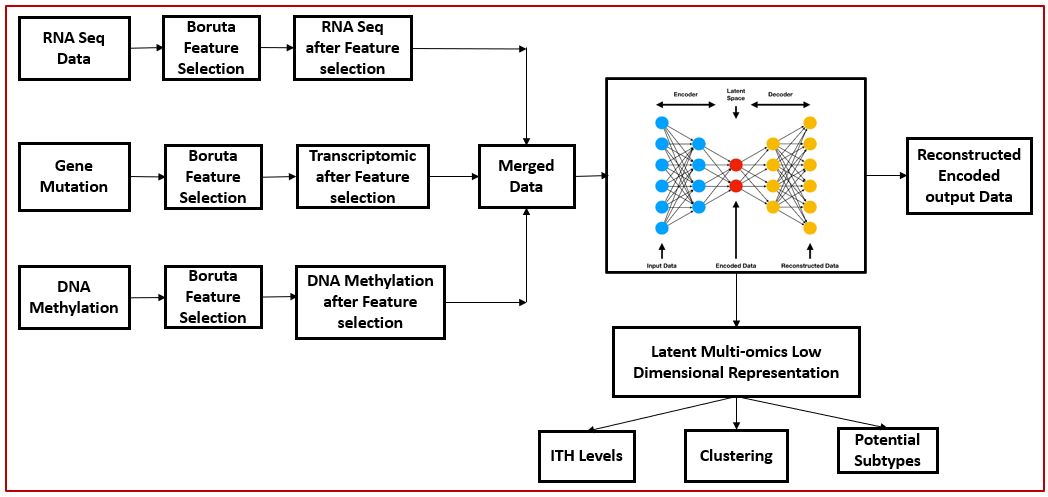
This project was implemented in several processes, including data pretreatment, statistical analysis, and machine learning analysis. In the data preprocessing stage, we cleaned and converted the raw data to develop the Boruta Feature selection Algorithm to extract the key features based on the Features Ranking. After the Iterations from algorithm, it generates the resulting features in form of Confirmed, Tentative, Rejected. So, the confirmed features are the important features when compared with the shadow features for each Dataset. Later, we started streaming down the analysis by Normalizing only the RNA Seq & DNA Methylation data and ran a differential abundance analysis using various analytical methods. Finally, I trained my models using the preprocessed data and an autoencoder-based approach, which is an unsupervised learning technique, to predict the intratumor heterogeneity levels from the extracted features using the Clinical Data which has different stages of Breast Cancer, can be compared on the Intratumor Heterogeneity Levels, based on this we can suggest the process for better Prognosis.
A. Boruta Feature selection Algorithm:
A wrapper-based method for leveraging Random Forest to find critical features is the Boruta feature selection algorithm. After training Random Forest on the expanded dataset, it generates shadow features by rearranging the original features. It compares the feature 10 relevance scores of the original features with the best shadow features during iterations. Rejected features are removed and those that have been confirmed features as important are marked and stored for the next analysis. By offering a more reliable estimate of feature relevance, Boruta addresses overfitting. For best results, experimentation with hyperparameters and data pretreatment is encouraged. Overall, Boruta aids in the selection of pertinent characteristics from the dataset to enhance the functionality of machine learning models.
B. Normalization:
Sorting RNA Seq and DNA methylation data requires normalization. It
eliminates technological biases, ensuring sample comparability and
precise identification of differential methylation and gene expression.
Data quality is improved, and useful downstream analysis are made
possible by methods like TMM or quantile normalization for RNA
sequencing and beta-value normalization for DNA methylation.
Understanding gene regulation and epigenetic mechanisms in varied
biological contexts and disorders is made easier by normalization.
Z-score normalization ensures that the data are centered around a
zero mean with a unit variance for each characteristic from the RNA
Seq and DNA methylation data. By removing scale discrepancies, this
procedure makes it easier to compare and analyze data from various
samples.
Equation:
Z = (x-mean)/ (standard deviation).
• Z is the data point's Normalized value.
• x = the original value of the data point
• mean = the mean of the dataset
• standard deviation = the standard deviation of the dataset.
C. Merging of Datasets:
In this Analysis, I am using the Join Function to merge the 4 datasets of RNA Seq, Gene Mutation, DNA Methylation & Clinical Data containing the column of breast Cancer Subtypes based on common samples, is a technique for combining two or more data sets based on a shared column or index is the join function. It performs database- style merging, enabling users to effectively combine data frames or tables. The join function combines the data, keeping only the rows where the values match in both data sets after supplying the column or index to match on. A new data set that integrates information from several sources as a result makes it possible to conduct in-depth analysis and gain fresh insights.
D. Machine Learning Analysis:
Autoencoder Model:
Autoencoder is an Unsupervised machine learning technique
including an autoencoder-based method. A class of neural network
called an autoencoder is made to discover effective ways to represent
data, usually for data compression, feature learning, or
dimensionality reduction. They are taught via unsupervised learning,
indicating that they don't need labeled input during training, and they
are a member of the neural network family.
Autoencoders work by encoding the input data into a lower-
dimensional representation, which can subsequently be used to
reconstruct the original data by using different combination of
features & different Autoencoder Model configuration. To reduce the
distinction between the initial input and the reconstructed output,
the network is trained. By doing this, the autoencoder gains the
ability to recognize and store in its hidden layers the most important
features and patterns of the incoming data.
Anomaly detection, denoising, image compression, and feature
learning are just a few uses for autoencoders. As a phase of
preprocessing for additional tasks like classification and regression,
they can be used alone or in conjunction with other machine learning
approaches.
Flow Chart of project:
Results
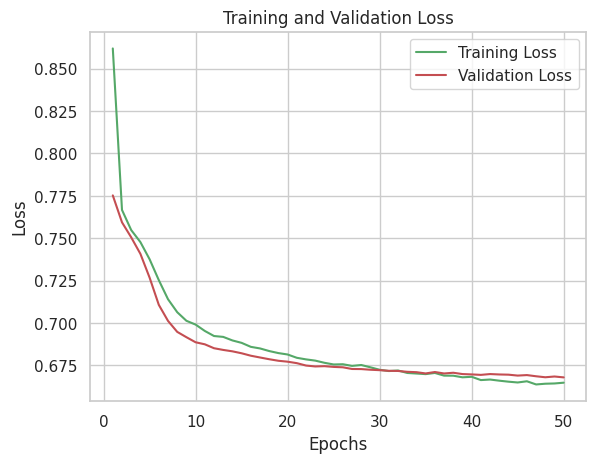
This downstream Analysis after the Feature Selection Process, Using the Autoencoder Model which is an unsupervised learning has seen the Important Features of Data where providing them into the Latent Representation which leads to the visualization of the features to identify how each of them are distinct from one another. This below fig:2 is the loss function curve of Autoencoder, where the firstly the training loss is high, but at certain epoch, there has been a convergence and the validation loss is higher than the training, which mean the model has learned the underlying patterns very well from the unseen data from training. Validation loss higher than Training loss with minimal gap & steadily decreasing leads to best fitting of model.
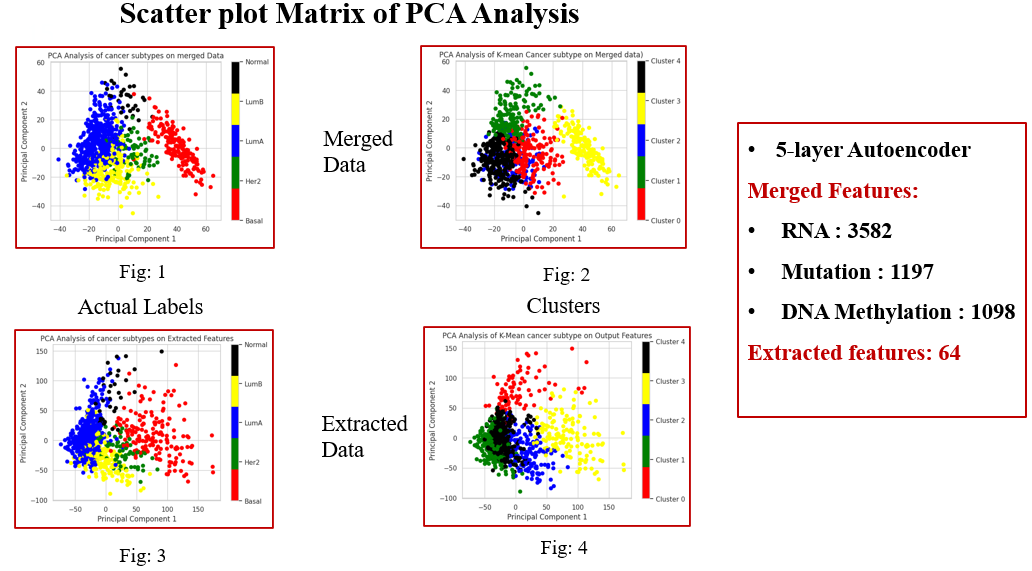
Here, is the below PCA visualization of the extracted/ Learned features from the latent representation of Autoencoder, used for next analysis like predicting the Intratumor Heterogeneity Levels & the stages of Breast Cancer Subtypes.
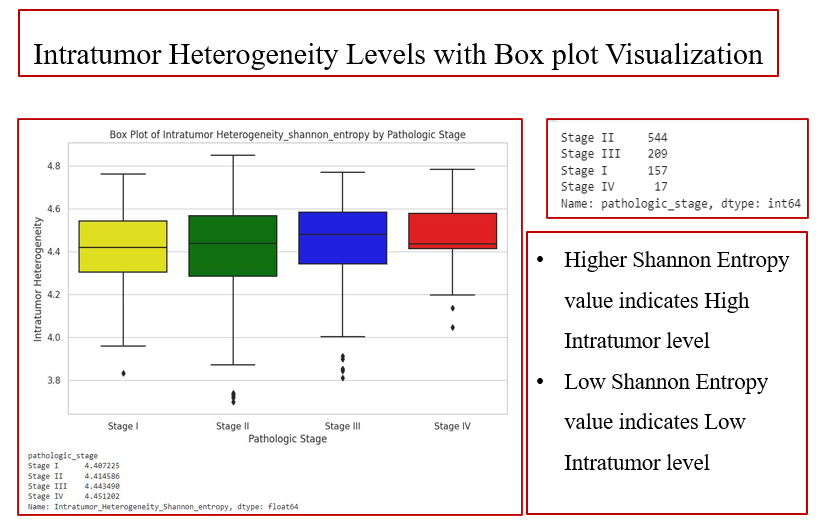
After, the Extracted features are being used to analyze the Intratumor Heterogeneity Level by using the Shannon Entropy based on the output of Autoencoder. This Below Fig: 4 shows the box plot visualization of features falling under the different stages based on their ITH levels. These Different stages are divided based upon the TNM [ T refers to primary tumor, N refers to No. of lymph node have cancer, M refers to spread of cancer to other body parts.] So, in this project the No. of sample sub categorized based on the ITH levels & Stages after the analysis are also presented. By this we can predict the stages of the patients and process for better prognosis
Conclusions
Precision medicine and cancer research have advanced significantly as a result of the project's Autoencoder Based Approach for Cancer Subtype Prediction & Intratumor Heterogeneity Level Estimation Using Multi-Omics Data. The pipeline reliably predicts cancer subtypes and evaluates intratumor heterogeneity by utilizing Autoencoders and multi-omics data integration. The robust performance of the model and its potential for clinical application present avenues for further investigation, including the incorporation of other data sources and clinical validation. This strategy shows potential for developing tailored treatment plans, identifying biomarkers, and altering cancer diagnostic and treatment choices. In summary, this marks a huge step forward in the study of cancer, with the potential to enhance patient outcomes and influence the course of precision oncology.